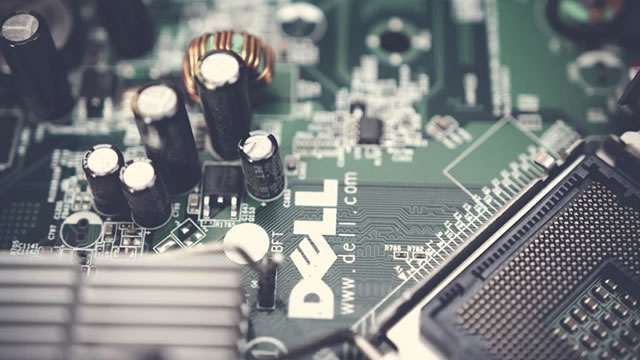
Michael Dell, a Dot-Com Era Survivor, Has Tips to Beat an AI Bust
While many tech firms are piling on debt for long-term AI projects, Michael Dell says just-in-time manufacturing cushions his eponymous company.
Fiscal Year: February - January
Dell Technologies Inc. (DELL), listed on the NYSE, has a market capitalization of $287.20B. As of Oct 19, 2026, the stock is trading at $451.71 per share@else an unavailable price , offering investors a clear view of its current market value. Dell Technologies Inc. is a prominent player in the industry sector, attracting both institutional and retail investors due to its performance and potential.
With a P/E ratio of 26.36, investors can assess the stock's valuation in comparison to its earnings. A P/E ratio is a crucial indicator for value investors, showing whether the stock is over or undervalued relative to its current earnings. Dell Technologies Inc. also offers a dividend yield of 0.56%, making it an attractive option for income-focused investors who seek regular dividends.
Our Discounted Cash Flow (DCF) analysis reveals that Dell Technologies Inc. (DELL) has a DCF fair value that is only shown to premium members. To see it, please Login or Upgrade for access.
The proprietary SS Score for Dell Technologies Inc. is a unique metric that analyzes the company's financial health and growth potential. The score takes into account critical factors such as revenue growth, net income, free cash flow (FCF) compound annual growth rate (CAGR), the trend of shares outstanding, and the debt-to-FCF ratio. This helps investors to make a more informed decision, as an undervalued stock might still have poor financial fundamentals.
To view the detailed SS Score for Dell Technologies Inc., Login or Upgrade for access.
The Price to Free Cash Flow (P/FCF) ratio for Dell Technologies Inc. is 33.55, offering insights into how much investors are paying for the company's free cash flow. A lower P/FCF ratio typically suggests that the stock is undervalued, while a higher ratio may indicate overvaluation.
In summary, Dell Technologies Inc. (DELL) has shown consistent financial performance, as illustrated by the financial charts above, which track its revenue growth, net income, free cash flow, and shares outstanding over the past several years. These metrics provide investors with key insights into the company's past and projected future performance. Investors should use the SS Score alongside the DCF Fair Value to make better-informed decisions about whether to buy or hold the stock.
*This analysis is for informational purposes only and does not constitute investment advice. Always read the company's 10-K filings and do your own research before making any investment decisions.
Whether Dell Technologies Inc. (DELL) is a good stock to buy depends on various factors, including its financial health, market conditions, and your investment strategy. It is important to assess the SS Score and review the company's fundamentals before making any investment decisions.
The fair value of Dell Technologies Inc. (DELL) is determined through our Discounted Cash Flow (DCF) analysis. This value represents the intrinsic worth of the stock based on its expected future cash flows. To view the specific fair value, consider subscribing to our service for complete access.
The SS Score is a proprietary financial quality metric that assesses factors such as revenue growth, net income, free cash flow growth, and debt levels. It helps investors evaluate the overall financial health of Dell Technologies Inc.. To access the full SS Score, consider upgrading your subscription.
Dell Technologies Inc. is a significant player in the industry sector, with a market capitalization of $287.20B and a competitive P/E ratio of 26.36. Investors should compare these metrics with industry peers to gauge whether Dell Technologies Inc. is outperforming or underperforming within its sector.
While many tech firms are piling on debt for long-term AI projects, Michael Dell says just-in-time manufacturing cushions his eponymous company.
Dell Technologies stock has pulled back sharply over the past few days, with its market capitalization falling from $375 billion earlier this month to about $300 billion today. The decline has coincid...
Dell shares are tumbling after a huge rally, as analysts say higher memory prices—not an enterprise AI breakthrough—are driving hardware revenue growth.
An analyst sees limited room for Dell and HPE shares to continue climbing, as dynamics could shift within the market for memory components.
Barclays downgraded Dell, HPE, and NetApp on concerns that enterprise AI adoption is lagging. Dell tumbled 11%, leading the drop on Wall Street.
Some of this year's hottest stocks are taking a hit Wednesday after downgrades from Barclays.
Shares of Dell Technologies (DELL), Hewlett Packard Enterprise (HPE) and NetApp (NTAP) fell in trading on Wednesday after Barclays downgraded all three stocks, citing elevated valuations and a lack of...
Morgan Stanley (MS) beat on the top and bottom line in earnings but showed weakness in its fixed income business. Barclays downgraded Dell Technologies (DELL), HPE (HPE), and NetApp (NTAP) after all e...
HPE stock, Dell Technologies, and NetApp are downgraded. All three stocks have surged this year.
Dell Technologies ($DELL) stock fell over 3% in Wednesday’s pre-market trading after Barclays analyst Tim Long downgraded the computer and server maker from Overweight to Equalweight. The 5-star analy...
Barclays downgraded Dell Technologies (DELL) to Equal Weight from Overweight with a price target of $574, down from $603. The firm is taking a more cautious approach on IT hardware…
Michael Dell said AI models need "safeguards and controls," and the government has a role to play. Anthropic's Dario Amodei and OpenAI's Sam Altman have backed efforts to pace frontier AI development ...
CNBC's David Faber sits down with Dell CEO Michael Dell to discuss the data center debate, the AI safety debate, and more.
Technology analyst Dan Ives has added SpaceX ($SPCX) and Dell Technologies ($DELL) to the Ives AI 30 list at Yorkville Ives, where he is a partner and senior managing director.
Donald Trump spent much of 2026 publicly praising Dell, but newly disclosed transactions show investments held in his name were later reduced after the stock's extraordinary AI-driven rally. A federal...
Tech giant Dell is planning to put a $1,000 in its employees' children's Trump Accounts. CEO Michael Dell said this week that such donations will become a standard corporate benefit.
Accenture (ACN) and Dell Technologies (DELL) announced a major expansion of their 20+ year collaboration with the formation of the Accenture Dell Business Group. Together, the companies can give enter...
NEW YORK--(BUSINESS WIRE)--Accenture and Dell Technologies announced a major expansion of their 20+ year collaboration with the formation of the Accenture Dell Business Group.
President Trump is awarding a number of top tech executives with medals at a science summit on Thursday. Elon Musk, Michael Dell, Microsoft CEO Satya Nadella and Google co-founder Sergey Brin are amon...
Dell Technologies (DELL) announced an expanded portfolio of Windows PCs and workstations built for the age of agentic AI. Together with Nvidia (NVDA) and Microsoft (MSFT), Dell delivers agentic AI…
SAN FRANCISCO--(BUSINESS WIRE)--Dell Technologies (NYSE: DELL) announces an expanded portfolio of Windows PCs and workstations built for the age of agentic AI. Together with NVIDIA and Microsoft, Dell...
Dell Technologies stock has continued its strong rally this year, making it one of the top gainers in the S&P 500 Index. It has soared by 347% this year, bringing its market capitalization to over $36...
ROUND ROCK, Texas--(BUSINESS WIRE)--Dell Technologies (NYSE: DELL) expands the Dell AI Data Platform so AI systems deliver better answers, cost less to run and reach production faster, giving applicat...
Projected from reported cash flow (SEC filings). The starting point is the latest yearly revenue times the median free cash flow margin of the last five years. Years 1 to 5 grow at the revenue growth rate of the last five years (between -5% and 15%), and years 6 to 10 slow down to the 2.5% perpetual growth rate. These are Studying Stocks' own estimates, not analyst forecasts, and are intended for educational purposes only as a baseline for the analysis.
| Year | FCF Estimate | % | Source |
|---|---|---|---|
| 2027 | 8.02B | 5.55% | Projected |
| 2028 | 8.47B | 5.55% | Projected |
| 2029 | 8.94B | 5.55% | Projected |
| 2030 | 9.43B | 5.55% | Projected |
| 2031 | 9.96B | 5.55% | Projected |
| 2032 | 10.45B | 4.94% | Projected |
| 2033 | 10.90B | 4.33% | Projected |
| 2034 | 11.31B | 3.72% | Projected |
| 2035 | 11.66B | 3.11% | Projected |
| 2036 | 11.95B | 2.50% | Projected |
Below are the FCF estimates with the discount factor and the calculated present value with the terminal value that led the results above.
| Year | FCF | Discount Factor | PV of Future FCF |
|---|---|---|---|
| 2025A | 1.87B | 1.00 | 1.87B |
| 2026A | 8.55B | 1.00 | 8.55B |
| 2027E | 8.02B | 1.09 | Login |
| 2028E | 8.47B | 1.20 | Login |
| 2029E | 8.94B | 1.31 | Login |
| 2030E | 9.43B | 1.43 | Login |
| 2031E | 9.96B | 1.57 | Login |
| 2032E | 10.45B | 1.72 | Login |
| 2033E | 10.90B | 1.88 | Login |
| 2034E | 11.31B | 2.05 | Login |
| 2035E | 11.66B | 2.25 | Login |
| 2036E | 11.95B | 2.46 | Login |
| Terminal | 2.46 | Login |
The information given by Studying Stocks and provided in the web and/or mobile applications (Platforms) is only factual information and should not be considered financial advice.
Any information contained in this website has been prepared without considering your objectives, financial situation or needs. You should not rely on any advice and/or information contained in this website and before making any investment decision we recommend that you consider whether it is appropriate for your situation and seek appropriate financial, taxation and legal advice.
When creating an account, you acknowledge that you are:
We retain the right to cancel your account for any reason, or refuse your account creation request.
The information on our Platforms is not comprehensive and is intended to provide a summary of the subject matter covered. While we use all reasonable attempts to ensure the accuracy and completeness of the data and information on our Platforms, to the extent permitted by law, we make no warranty regarding the information on these Platforms. You should monitor any changes to the information contained on these Platforms.
Furthermore we make no commitments in regards to the minimum amount of uptime that our platforms will maintain, although we will make ever reasonable attempt to ensure that the platforms are operational. Therefore, any reference of "latest", "current" and related words about the financial data presented here may not be up to date with the financial markets or represent reality of the information.
We are not liable to you or anyone else if interference with or damage to your computer systems occurs in connection with the use of these Platforms or a linked website. You must take your own precautions to ensure that whatever you select for your use from our Platforms is free of viruses or anything else (such as worms or Trojan horses) that may interfere with or damage the operations of your computer systems.
We may, from time to time and without notice, change or add to the Platforms (including the Terms) or the information, products or services described in it. However, we do not undertake to keep the Platforms updated. We are not liable to you or anyone else if errors occur in the information or the Platforms is not up-to-date.
Our Platforms may contain links to websites operated by third parties. Those links are provided for convenience and may not remain current or be maintained. Unless expressly stated otherwise, we do not endorse and are not responsible for the content on those linked websites and have no control over or rights in those linked websites.
These Platforms are for your personal, non-commercial use only. You may not modify, copy, distribute, transmit, display, perform, reproduce, publish, license, commercially exploit, create derivative works from, transfer, or sell any Content, software, products or services contained within these Platforms. You may not use these Platforms, or any of its Content, to further any commercial purpose, including any advertising or advertising revenue generation activity on your own website.
You must not do any act that we would deem to be inappropriate, is unlawful or is prohibited by any laws applicable to these Platforms, including but not limited to:
If we allow you to post any information to our Platforms, we have the right to take down this information at our sole discretion and without notice.
To the maximum extent permitted by law, we make no warranties or representations about these Platforms or the Content, including but not limited to warranties or representations that they will be complete, accurate or up-to-date, that access will be uninterrupted or error-free or free from viruses, or that these Platforms will be secure.
We reserve the right to restrict, suspend or terminate without notice your access to these Platforms, any Content, or any feature of these Platforms at any time without notice and we will not be responsible for any loss, cost, damage or liability that may arise as a result.
To the maximum extent permitted by law, in no event shall we be liable for any direct and indirect loss, damage or expense – irrespective of the manner in which it occurs – which may be suffered due to your use of our Platforms and/or the information or materials contained on it, or as a result of the inaccessibility of these Platforms and/or the fact that certain information or materials contained on it are incorrect, incomplete or not up-to-date.
This website utilises cookies. If you do not have cookies enabled in your web browser some functions of the site may not work as intended.